The UK Cities Worst Affected by the Housing Crisis

The UK media is filled with news about the UK’s housing crisis, with a shortage of properties around the country leading to rising house prices and young people struggling to get on the property ladder.

In contradiction to this, we also hear news of the rising number of vacant homes around the UK.

The team at CIA Landlords set out to discover the cities that have the most vacant homes and those that have the worst housing crisis to see if there is a correlation between the two.  Through this research, we can discover whether fixing the vacant homes issue could simultaneously help some cities solve their housing shortage issue.

We also looked at brownfield land availability in cities across the UK to assess which cities across the UK would benefit most from developing houses on their available brownfield land.

Bournemouth has the costliest number of vacant homes outside of London

Due to London’s vast size, there are a total of 87,731 vacant homes making it the top city in the UK for the costliest number of vacant homes. With London house prices averaging around £1.49 million, the cost of vacant homes in the capital is approximately £130.8 billion.

When looking at the number of vacant homes in Bournemouth (7,213) and comparing this to the average house price in the city (£414,624), our study determined that the average cost of vacant homes is nearly £3 billion. Bournemouth, therefore, has the second most costly number of vacant homes in the UK (top outside of London).

Vacant homes are an issue throughout the UK. Our study found that cities such as Manchester (3rd) and Leeds (8th) also have vacant homes worth millions of pounds that could help alleviate the housing crisis if they were to be sold and occupied.

Here you can see the top 10 cities in the UK for the costliest number of vacant homes:

Rank UK city No. of vacant homes (2021) Average house price (£) (2022) Approximate cost of vacant homes (£)
1 London 87,731 1,490,332 130,748,291,250
2 Bournemouth 7,213 414,624 2,990,686,158
3 Manchester 8,024 279,475 2,242,508,523
4 Birmingham 6,975 302,117 2,107,263,146
5 Brighton & Hove 3,388 492,002 1,666,902,200
6 Bristol 3,735 422,842 1,579,313,488
7 Coventry 4,399 348,685 1,533,863,863
8 Leeds 4,857 290,905 1,412,926,216
9 Bradford 6,056 229,782 1,391,558,217
10 Reading 2,595 445,967 1,157,284,365

Liverpool is currently experiencing the worst housing crisis in the UK 

Our team has discovered which cities in the UK are suffering from a housing crisis the most. In order to do this we took the city’s population and divided it by the average number of people living in a single property to reveal how many properties each city needs.
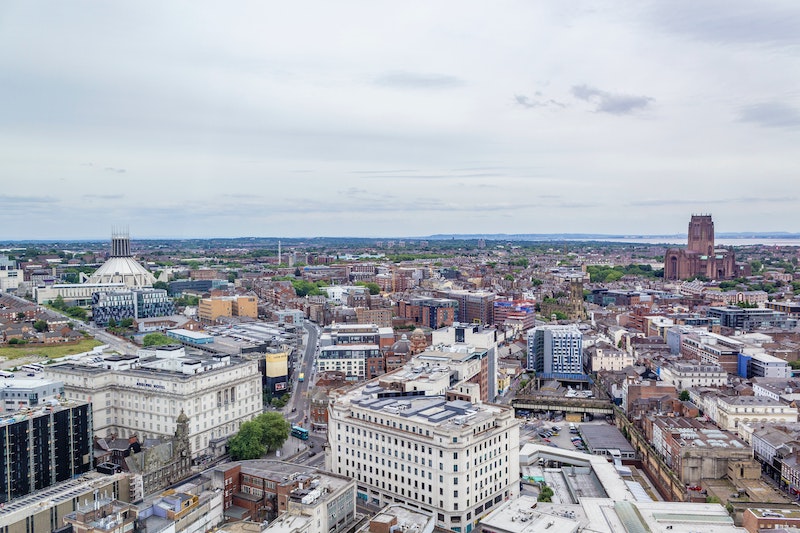
Liverpool is currently experiencing the worst housing crisis in the UK with a deficit of nearly a quarter of a million homes. It was reported at the end of 2021 that the city has a £36m brownfield project plan to add nearly 3,000 homes to the city to help aid the housing crisis.

Leicester has the 2nd worst housing crisis in the UK, with a deficit of around 135,201 homes needed.

Here you can see the top 10 cities in the UK for worst housing crisis by a deficit of homes:

Rank City Number of properties needed 2022 Deficit of houses
1 Liverpool 466,626 -232,759
2 Leicester 274,815 -135,201
3 Bristol 333,331 -129,770
4 Sheffield 370,099 -116,362
5 Reading 171,728 -100,423
6 Cardiff 241,535 -88,170
7 Stoke-on-Trent 201,299 -83,609
8 Birmingham 531,540 -82,728
9 Luton 139,330 -58,041
10 Coventry 194,001 -49,062

London, Leeds and Bournemouth have the highest number of surplus homes in the UK

On the other end of the scale, cities around the UK with an abundance of homes include London, Leeds and Bournemouth who have high numbers of surplus properties available.
For now, cities such as Edinburgh and Swindon have small numbers of surplus homes, but this could change in the future – especially with Edinburgh’s rising population levels, due to increasing numbers of people from around Scotland and other parts of the UK moving to the Scottish capital.

Here you can see the top 10 cities in the UK for surplus housing:

Rank City Number of properties needed 2022 Surplus of houses
1 London 4,839,474 445,83
2 Leeds 245,766 111,041
3 Bournemouth 88,344 97,908
4 Bradford 161,627 56,265
5 Brighton & Hove 75,061 54,260
6 Newcastle-Upon-Tyne 103,886 30,439
7 Manchester 213,578 21,446
8 Aberdeen 106,202 14,778
9 Edinburgh 251,095 3,834
10 Swindon 100,229 40

Solving Glasgow’s vacant home issue could help ease their housing crisis by 86.4%

Our data found that over 86% of Glasgow’s housing deficit could be considerably lessened if some of their vacant homes were inhabited. Thus making it the city with the most to gain from solving their vacant homes issue.

The next city to benefit most from vacant homes being lived in is Portsmouth. This city could see its housing crisis decrease by over one-fifth if vacant homes were sold to those on the hunt for a new home.

Of the cities where we can see there is a deficit of houses, our data found that the following five cities would benefit the most from selling of their vacant homes:

Rank City % of deficit reduced by selling of vacant homes
1 Glasgow 86.38
2 Portsmouth 20.53
3 Coventry 8.97
4 Birmingham 8.43
5 Plymouth 8.03

Coventry’s housing crisis could be reduced 73% by maximising their brownfield land potential

We found that maximising brownfield housing potential in Coventry would have a profound impact on the city’s housing crisis. The city’s housing crisis could potentially be reduced by nearly three quarters (73%).

Coventry is not the only city where brownfield potential could make a huge difference to a city’s housing crisis. Plymouth, Nottingham, Portsmouth and Birmingham all have the potential to ease their housing crisis considerably if they were to take advantage of their brownfield housing potential.

We can also see from this data that certain cities, such as Manchester, London and Edinburgh actually do not necessarily need to spend their money on further housing development as they currently have a surplus property.

Table Key

Negative (-) numbers = Deficit of houses

Positive number = Surplus housing

City Housing crisis currently (2022) Number of properties that could be built on brownfield land Housing crisis if brownfield potential was maximised Housing crisis difference when brownfield potential maximised (%)
Edinburgh 3,834 37,000 40,834 965%
Manchester 21,446 100,048 121,494 467%
Coventry -49,062 36,000 -13,062 73%
London 445,831 256,407 702,238 58%
Plymouth -19,730 7254 -12,476 37%
Nottingham -31,726 10,116 -21,610 32%
Portsmouth -13,611 4170 -9,441 31%
Birmingham -82,728 23,000 -59,728 28%
Leeds 111,041 30,000 141,041 27%
Newcastle-Upon-Tyne 30,439 7307 37,746 24%
Derby -34,287 6651 -27,636 19%
Sheffield -116,362 20,838 -95,524 18%
Norwich -48,006 7804 -40,202 16%
Southampton -23,748 3779 -19,969 16%
Bradford 56,265 7773 64,038 14%
Luton -58,041 6702 -51,339 12%
Brighton & Hove 54,260 4868 59,128 9%
Stoke-on-Trent -83,609 7073 -76,536 8%
Kingston-Upon-Hull -46,847 2747 -44,100 6%
Bristol -129,770 6602 -123,168 5%
Liverpool -232,759 10,994 -221,765 5%
Leicester -135,201 4927 -130,274 4%
Wolverhampton -24,305 949 -23,356 4%
Bournemouth 97,908 2971 100,879 3%
Reading -100,423 51 -100,372 0%

From analysing the data above, we can see that the housing crisis cannot necessarily be eradicated with the selling of vacant homes and building on brownfield sites alone. However, in tackling these issues, cities could see a noticeable reduction in their overall housing crisis.

Methodology

Key for where in the UK have the costliest number of vacant homes

We took the number of vacant homes per city and the average price of a property in each city to figure out the cost of each city’s vacant homes.

Key for where has worst housing crisis UK

There are 67.22 million people in the UK and 361061 people on average looking for property in the UK in 2021.

361,061 is 0.54% of 67.22million

0.54% of each city’s population, therefore, tells us on average how many people are looking for properties to buy.

We then compared this to how many properties there are available for sale in each city to see whether each city has enough properties for their housing needs.

Key for percentage of a city’s housing crisis that could be solved by selling on of vacant homes

To do this we checked the percentage difference of housing deficit before and after the potential selling of vacant homes.

Key for brownfield land potential

To do this we took the number of homes (deficit or surplus) currently available in each city and calculated the difference of available homes if brownfield land potential was maximised in each city to find out which cities would see the biggest benefit.


Sources

Data.london.gov.uk

actiononemptyhomes.org

northamptonchron.co.uk

cardiff.moderngov.co.uk

Glasgowlive.co.uk

Housesforsaletorent.co.uk

Rightmove.co.uk

Citymayors.com

Worldpopulationreview.com

Birminghammail.co.uk 

S3-eu-west-1.amazonaws.com

gov.uk./government/statistical-data-sets/

Statistics.gov.scot

Statswales.gov.wales

Furnished v Unfurnished: How much can landlords make by furnishing their rental properties?

Furnished v Unfurnished: How much extra can landlords make by furnishing their rental properties? 

As a landlord, you are under no legal obligation to furnish your property. However, providing basic household items for your tenants, such as beds, appliances, sofas, and wardrobes, could maximize your profits and increase your monthly income. But how much can landlords make from their furnished and unfurnished rentals?

New research by CIA Landlord Insurance has revealed the average monthly income for landlords with both furnished, part-furnished, and unfurnished properties around the UK, and assessed where renters can expect to find the largest selection of properties to suit their needs.

Landlords in London can make nearly £10,000 per month if they furnish their property 

With the high demand for rental properties in London, due to the high population and many moving for job opportunities, there is a huge opportunity for landlords to make money. But how much extra income could furnishing a property provide?

On average, landlords with rentals in London receive £2,189 a month. However, if they furnished their property, they can expect to maximize their profits by 316% and rake in nearly £110,000 a year on average, £9,120 per month.

Bristol ranks as the second most profitable location for landlords who furnish or are looking to, furnish their properties, with the average monthly income being £2,038. Following closely behind is Brighton and Hove, where landlords can rake in £1,898 per month for their furnished property, giving them a yearly income of nearly £23,000.

Landlords should be aware that although some locations offer them more money per month for a furnished property, after investing in the required items it may not be worth it long term. For example, Landlords in Bournemouth can make just £4 extra per month for furnishing a property which is a minimal profit.

The following table shows the cities where landlords can make the most money if they furnish their property:

Rank  UK City  Average rent per month for a 1-4 bed furnished property (£) Average rent per month for a 1-4 unfurnished property (£) How much extra landlords make per month by furnishing their property (£)
1 London 9,120 2,189 6,931
2 Bristol 2,038 1,355 683
3 Brighton & Hove 1,898 1,436 462
4 Edinburgh 1,604 1,232 372
5 Reading 1,436 1,242 194
6 Liverpool 1,393 985 408
7 Manchester 1,371 1,098 273
8 Cardiff 1,219 1,043 176
9 Nottingham 1,124 872 252
10 Bournemouth 1,098 1,094 4


It costs on average £1,666 for a landlord to furnish a one-bed property 

To gain a better understanding on what classifies as a furnished property, we spoke to Paul Gibbons, a property specialist at HouseBuyers4u. He says: “furnished properties include all or most white goods such as cookers, fridges, freezers, and washing machines, and basic furniture like sofa, chairs, tables, wardrobes and beds. Unfurnished does not include any furniture and the tenant is expected to furnish the house.”

Using Paul’s comments we then curated the average cost of furnishing a property to reveal how much landlords can expect to initially pay out when making their property fit these standards. If landlords deck out their rentals with; a double bed, wardrobe, two seater sofa, dining table, bedside tables, microwave, kettle, toaster and TV, it will cost them an average of just £1,666 to create a fully furnished one-bed property. In many cities across the UK, this is less than a month’s rent, making furnished properties a very profitable business opportunity in the right locations.

Plymouth is the least profitable location for landlords with furnished properties 

If landlords furnish a property, they can alleviate the additional stress that short-term renters can often encounter when buying, storing and reselling furniture. But the least profitable location for them to do this in is Plymouth. With furnished rentals costing £225 less per month than unfurnished ones, landlords could reduce their annual income potential by £2,700 if they provide furniture for their tenants.

However, Plymouth is the most financially viable city for renters looking for furnished properties as prices here sit at just £606 per month. Renters are therefore saving over £8,500 more pcm than London renters for the same properties.

Northampton also sees the biggest price difference between furnished and unfurnished properties- those with furniture cost £274 less per month to rent than empty ones. This means renters here can annually save £3,288 by choosing to opt for a furnished property.

The following table shows the cheapest UK Cities to rent a furnished property:

Rank  UK City  Average rent per month for a 1-4 bed furnished property (£) Average rent per month for a 1-4 bed  unfurnished property (£) How much renters save choosing a furnished property per month (£)
1 Plymouth 606 831 225
2 Stoke-on-Trent 634 628 -6
3 Wolverhampton 635 771 136
4 Bradford 666 628 -38
5 Derby 684 814 130
6 Aberdeen 692 824 132
7 Northampton 713 987 274
8 Coventry 818 876 58
9 Luton 846 1,052 206
10 Sheffield 858 741 -117

Wolverhampton offers the most business opportunities for landlords with furnished properties 

There are huge cost differences in how much landlords can make if they rent out a furnished property across the UK. But to reveal where landlords can easily make their property stand out against competition, we looked at how many active furnished, part-furnished, and unfurnished rentals there are in various UK cities.

London has the highest proportion of furnished properties in the UK – in May 2022 there were over 10,000 furnished rentals listed on Zoopla. However, this means that landlords will have to compete against each other to make their property stand out and attract renters. Although London offers huge earning potential for those that furnish their properties, landlords should consider how easy it will be to attract and retain tenants.

The following table shows the UK cities with the highest amount of furnished properties to rent:

Rank  UK City  The number of listed furnished rental properties  Number of part-furnished listed rental properties  Number of unfurnished listed rental properties 
1 London >10000 6085 9519
2 Birmingham 1500 101 546
3 Coventry 1139 42 148
4 Manchester 1022 108 252
5 Leeds 874 52 258
6 Leicester 868 48 285
7 Liverpool 682 103 375
8 Nottingham 575 40 260
9 Edinburgh 559 27 96
10 Aberdeen 528 21 59

The UK city with the least amount of furnished rentals is Swindon- just 28 furnished properties were listed here in May 2022 meaning the city offers the most business potential for landlords with furnished properties due to the lack of competition.

The UK city with the second-least amount of competition for furnished property is Wolverhampton where just 32 furnished properties were listed in comparison to 88 unfurnished. Wolverhampton also has a higher population than Swindon, there are 252,791 residents in Wolverhampton compared to 185,609 in Swindon, so landlords also have a larger market to attract business to.

Whilst Swindon has minimal furnished properties on offer, they have a higher proportion of unfurnished rentals listed- 100 compared to 28. This is the case for the majority of UK cities, so is there actually a demand for furnished properties?

The following table shows the UK cities with the least amount of furnished properties to rent:

Rank  UK City  The number of listed furnished rental properties  Number of part-furnished listed rental properties  Number of unfurnished listed rental properties 
1 Swindon 28 10 100
2 Wolverhampton 32 9 88
3 Bradford 50 19 88
4 Northampton 67 5 75
5 Bournemouth 72 5 61
6 Luton 87 58 116
7 Portsmouth 129 11 50
8 Stoke-on-Trent 143 8 96
9 Norwich 212 6 69
10 Southampton 229 64 133


The demand for furnished properties within the UK has increased by 19% since last year

Within the UK there has been an overall increase in people looking for furnished properties, searches for ‘furnished rental’ have risen by 19% in the last twelve months. On the other hand, there has been a huge decline for people looking for unfurnished rental properties, with internet searches dropping by 202% in the past year. This could be due to the cost of living rising so more people are less inclined to move out of their current rentals and look elsewhere due to financial pressures.

Christopher Walkey, owner of Estate Agent Networking, says “although a fully furnished or part furnished property will come with more responsibility for the landlord, by offering such a property, landlords can look to target, and increase, interest from certain types of tenants who are looking for shorter term rental agreements.” This means that landlords are immediately increasing their target audience by furnishing a rental property.

Although demand for property offerings is always changing, it is clear that landlords can make money if they furnish their properties in many UK cities. Moving forward, landlords should assess the landscape before making decisions, and also attempt to meet renters’ demand in order to stand out against their competition and create the most profit.

Sources and methodology 

We selected 1- 4 bedroom properties and applied the furnished, un-furnished and partly-furnished filter to get the average monthly rental costs for each UK city. Please note London is capped at 10,000+ properties per search. We then used Ikea and Amazon to get the average price of furnishing a property – the average price was taken by scraping the first page of the website.

www.zoopla.co.uk

www.ikea.com

www.amazon.co.uk

worldpopulationreview.com